Top 10 Application [Bytes or Flows]
The Top 10 Application table lists the top 10 applications generating the largest number of bytes or flows. Click on the + sign to the left of the Application name to show the devices associated with the application.
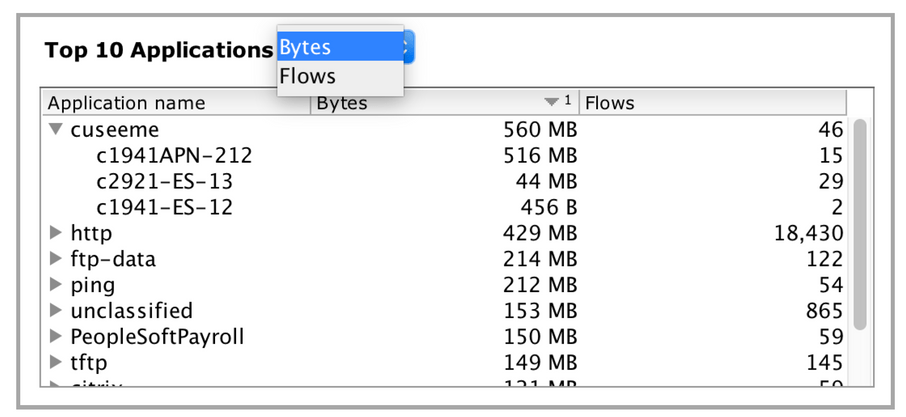
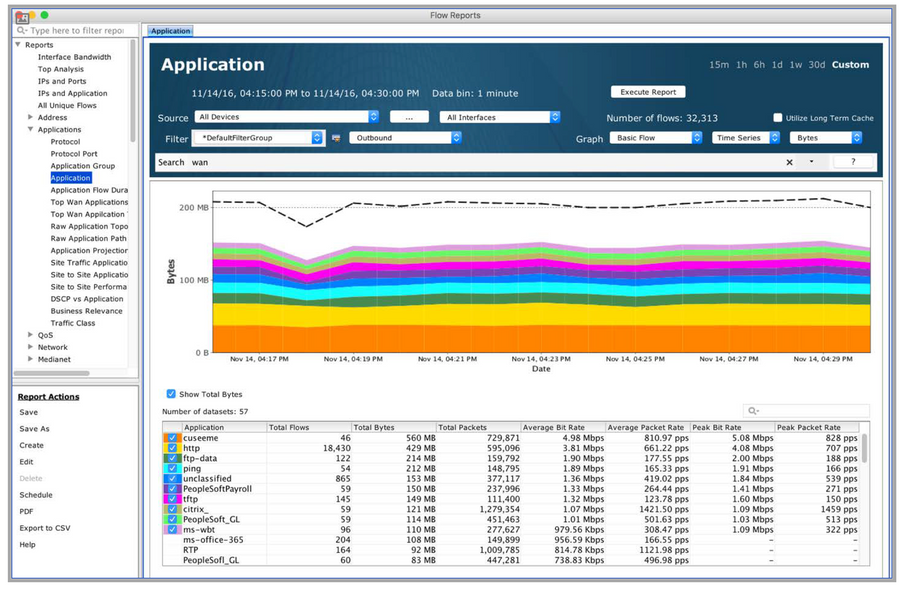
Click on the Top 10 Applications header to generate an Application outbound flow report for all devices and all interfaces sorted in order by Bytes or Flows as selected from the previous table.
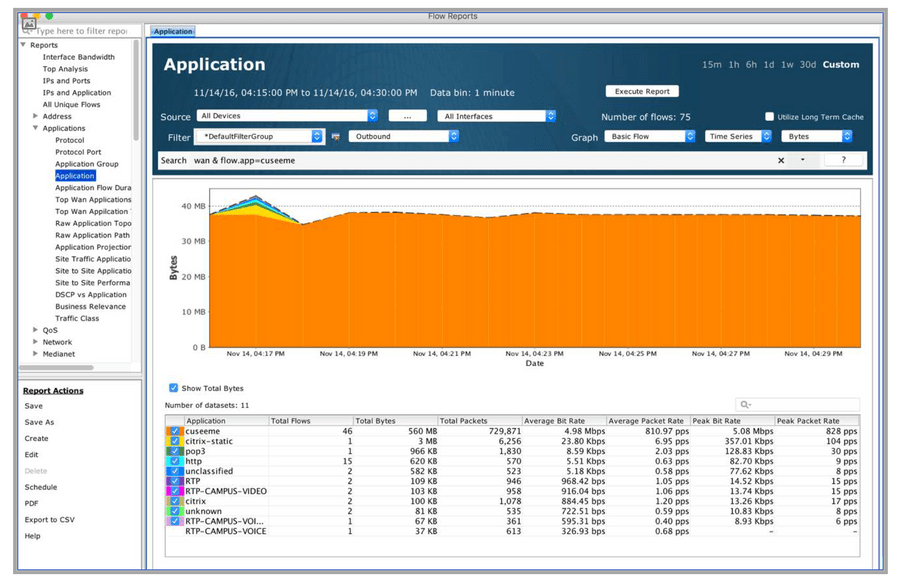
Right click on an application in the table to graph all applications across all devices.
Expand an application in the table to show devices and right click on a device to select between Graph View and Top Analysis View.
Graph View – generates an Application outbound flow report for all applications and all devices within the system.

Top Analysis View – generates a Top Analysis outbound flow report for the selected device.
